
It has been widely suggested that one of the catalysts for the implementation of the new rule was the disproportionally long 2012 Australian Open Final between Rafael Nadal and Novak Djokovic, which lasted a record breaking 5 hours and 53 minutes. Steve Tignor wrote about their first match in 2013, the Monte Carlo finals:
These statistics - 1:52 and 2:20 for 21 games - are clearly not enough by themselves, and seemed misleading to me. Taken to the extreme, if every game ends after 40-0 (or 0-40), the match will be much quicker than if every game goes to deuce. Therefore, I checked the number of points played in both matches, and was surprised to see them nearly equal - the 2013 Monte Carlo final had 139 points, and the 2012 Rome Final - 143 points. This piqued my interest, and I decided to compare all of the 34 Nadal-Djokovic matches in terms of the average elapsed time per point^ - the overall match length divided by the total number of points played.The tour decided to crack down on slow play in large part because of these two. Their six-hour Australian Open final was the catalyst, but their 4-hour, three-set Madrid semi in 2009 also lives in plodding-play infamy as well. Their points are long, of course, but in the past, when they faced each other, they seemed liberated to take even longer between them than they did against anyone else.Yesterday was different. This Monte Carlo final lasted 21 games and took 1 hour, 52 minutes. Last year’s Rome final between these two also lasted 21 games, but took 2 hours, 20 minutes. There were, as far as I saw, no official time warnings handed out by chair umpire Mohamed Lahyani, and both guys were moving with dispatch.
There were several questions that seemed interesting to me before doing the analysis:
- Will the pair's longest matches (AO '12 for five-setters, Madrid '09 for best of three) be the ones with the longest time per point?
- Will their Monte Carlo match be the shortest, as we might expect?
- How did the time/point change over time in the rivalry?
- Does surface play a part?
| Yr | Tourn* | Surface | Win | Final Score | Pts** | Time | Time/pt |
|---|---|---|---|---|---|---|---|
| 07 | Wimb | Grass | Nad | 36 61 41 RET | 132 | 1:41 | 45.91 |
| 08 | Queen | Grass | Nad | 76(6) 75 | 172 | 2:16 | 47.44 |
| 13 | MC | Clay | Djo | 62 76(1) | 139 | 1:52 | 48.35 |
| 07 | IW | Hard | Nad | 62 75 | 116 | 1:34 | 48.62 |
| 07 | Miami | Hard | Djo | 63 64 | 119 | 1:37 | 48.91 |
| 07 | RG | Clay | Nad | 75 64 62 | 181 | 2:28 | 49.06 |
| 08 | OG | Hard | Nad | 64 16 64 | 160 | 2:11 | 49.13 |
| 09 | WTF | Hard | Djo | 76(5) 63 | 144 | 1:58 | 49.17 |
| 09 | Cincy | Hard | Djo | 61 64 | 111 | 1:32 | 49.73 |
| 07 | WTF | Hard | Nad | 64 64 | 125 | 1:44 | 49.92 |
| 11 | Wimb | Grass | Djo | 64 61 16 63 | 177 | 2:28 | 50.17 |
| 07 | Canada | Hard | Djo | 75 63 | 132 | 1:51 | 50.45 |
| 08 | Cincy | Hard | Djo | 61 75 | 102 | 1:26 | 50.59 |
| 08 | RG | Clay | Nad | 64 62 76(3) | 198 | 2:49 | 51.21 |
| 08 | IW | Hard | Djo | 63 62 | 101 | 1:28 | 52.28 |
| 10 | USO | Hard | Nad | 64 57 64 62 | 255 | 3:43 | 52.47 |
| 09 | Paris | Hard | Djo | 62 63 | 88 | 1:17 | 52.50 |
| 09 | DC | Clay | Nad | 64 64 61 | 169 | 2:28 | 52.54 |
| 07 | Rome | Clay | Nad | 62 63 | 113 | 1:41 | 53.63 |
| 08 | Hamburg | Clay | Nad | 75 26 62 | 203 | 3:03 | 54.09 |
| 09 | Rome | Clay | Nad | 76(2) 62 | 136 | 2:03 | 54.26 |
| 06 | RG | Clay | Nad | 64 64 RET | 126 | 1:54 | 54.29 |
| 10 | WTF | Hard | Nad | 75 62 | 123 | 1:52 | 54.63 |
| 12 | MC | Clay | Nad | 63 61 | 86 | 1:19 | 55.12 |
| 11 | IW | Hard | Djo | 46 63 62 | 158 | 2:26 | 55.44 |
| 11 | USO | Hard | Djo | 62 64 67(3) 61 | 268 | 4:10 | 55.97 |
| 09 | MC | Clay | Nad | 63 26 61 | 174 | 2:43 | 56.21 |
| 12 | RG | Clay | Nad | 64 63 26 75 | 241 | 3:49 | 57.01 |
| 12 | AO | Hard | Djo | 57 64 62 67(5) 75 | 369 | 5:53 | 57.40 |
| 11 | Miami | Hard | Djo | 46 63 76(4) | 205 | 3:22 | 59.12 |
| 12 | Rome | Clay | Nad | 75 63 | 143 | 2:21 | 59.16 |
| 09 | Madrid | Clay | Nad | 36 76(5) 76(9) | 245 | 4:03 | 59.51 |
| 11 | Rome | Clay | Djo | 64 64 | 130 | 2:13 | 61.38 |
| 11 | Madrid | Clay | Djo | 75 64 | 133 | 2:18 | 62.26 |
| Yr | Tourn. | Surface | Win | Final Score | Pts | Time | Time/pt |
| Average | 161 | 2:23 | 53.17 |
* AO = Australian Open, Cincy = Cincinnati, DC = Davis Cup WG R1 ESP-SRB, IW = Indian Wells, MC = Monte Carlo, OG = Beijing Olympics, RG = Roland Garros, USO = US Open, Wimb = Wimbledon, WTF = Masters Cup/World Tour Finals
** Pts = Total points, Time = match time (hours:minutes), Time/pt = average elapsed time per point (seconds)
Several interesting observations can be made at first glance -
- Monte Carlo is in the top 3 of 'quickest play' between Nadal and Djokovic, while the other two matches in the top 3 were played on grass.
- The bottom of the table is rich in clay matches (more on that later).
- The pair's 2011-2012 matches are all (together with Madrid 2009 and Monte Carlo 2009) at the bottom of the table, except for Wimbledon 2011 (which is played on... grass).
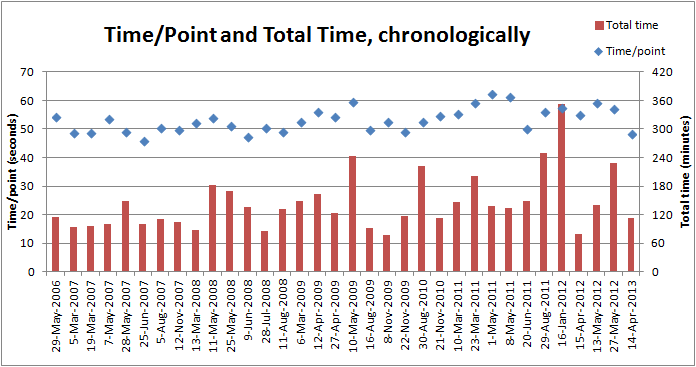
Curiously, from the 2010 US Open and through the 2011 clay season, the period of Djokovic's ascendancy to the no. 1 spot, the time/point steadily rises. It drops in Wimbledon 2011, and never gets to the same peak again. Of course, time/point includes both the time of play and the time between points, and during the four Masters 1000 tournaments of 2011, Nadal and Djokovic played some of their most grueling matches in terms of rally length (it would be interesting to get those numbers, if they exist anywhere in the hawk-eye archives). Notably, the time/point during the 2012 Australian Open wasn't as high as during Miami, Madrid or Rome in 2011 (although it's, of course, quite high).
Now, let's take a look at the surfaces. If we simply divide the above table into two halves ('quicker' and 'slower' matches), with 17 matches in each, and count the surfaces in each half, this is what we get:
| Hard | Clay | Grass | |
|---|---|---|---|
| Top half (time/point < 52.52) | 11 | 3 | 3 |
| Bottom half (time/point > 52.52) | 5 | 12 | 0 |
Without going into statistics too much, the numbers for hard courts and clay courts suggest that there's a significant difference between the two halves. In other words, hard court matches between Nadal and Djokovic tend to be in the top half (i.e. quicker), while the clay court meetings tend to be in the bottom half (slower). Generally, 3 matches on grass are not a large enough sample to draw statistical conclusions of this kind, but it's not surprising that the grass matches they did have are in the top half, especially since two of them are the quickest matches they had in terms of elapsed time per point. The overall conclusion is, of course clear - hard courts (and grass, most likely) meetings between the two players are quicker, clay court matches are slower.
It will be interesting to see if future matches between the two, especially on clay, continue the Monte Carlo trend (which goes against the usual pattern of play) and become quicker than what we (and the players) are accustomed to.
What other statistics and information would you like to see about those matches? Are there any more type of matches you'd like to see analyzed that way? Questions and comments will be very much welcomed.
^ Methodology:
Sources: I extracted the data of the Djokovic-Nadal head-to-head from Jeff Sackman's wonderful TennisAbstract website. The missing data for their lone Davis Cup meeting was manually filled in from the official match scorecard, which is available on the Davis Cup website.
Data: The ATP statistics include the overall match time (in hours and minutes), as well as the total number of points played during the match. For each match, I calculated ((match time in minutes)*60)/(total points) to get the average elapsed time per point, in seconds. The time measured by tennis officials includes changeovers, medical timeouts and various other stops in play, and therefore the time/point statistic does not reflect the actual time the ball is in play (especially since time between points, as we know, is somewhat volatile).
Graphic representation: Working with excel sucks. The X axis in the graphs is a category axis (and not a time axis), the points on it are equidistant and do not reflect the actual time between Nadal-Djokovic matches.
Raw data, in chronological order of the matches:
| Yr | Tourn. | Surface | Win | Final Score | Pts | Time | Time/pt |
|---|---|---|---|---|---|---|---|
| 06 | RG | Clay | Nad | 64 64 RET | 126 | 1:54 | 54.29 |
| 07 | IW | Hard | Nad | 62 75 | 116 | 1:34 | 48.62 |
| 07 | Miami | Hard | Djo | 63 64 | 119 | 1:37 | 48.91 |
| 07 | Rome | Clay | Nad | 62 63 | 113 | 1:41 | 53.63 |
| 07 | RG | Clay | Nad | 75 64 62 | 181 | 2:28 | 49.06 |
| 07 | Wimb | Grass | Nad | 36 61 41 RET | 132 | 1:41 | 45.91 |
| 07 | Canada | Hard | Djo | 75 63 | 132 | 1:51 | 50.45 |
| 07 | WTF | Hard | Nad | 64 64 | 125 | 1:44 | 49.92 |
| 08 | IW | Hard | Djo | 63 62 | 101 | 1:28 | 52.28 |
| 08 | Hamburg | Clay | Nad | 75 26 62 | 203 | 3:03 | 54.09 |
| 08 | RG | Clay | Nad | 64 62 76(3) | 198 | 2:49 | 51.21 |
| 08 | Queen | Grass | Nad | 76(6) 75 | 172 | 2:16 | 47.44 |
| 08 | Cincy | Hard | Djo | 61 75 | 102 | 1:26 | 50.59 |
| 08 | OG | Hard | Nad | 64 16 64 | 160 | 2:11 | 49.13 |
| 09 | DC | Clay | Nad | 64 64 61 | 169 | 2:28 | 52.54 |
| 09 | MC | Clay | Nad | 63 26 61 | 174 | 2:43 | 56.21 |
| 09 | Rome | Clay | Nad | 76(2) 62 | 136 | 2:03 | 54.26 |
| 09 | Madrid | Clay | Nad | 36 76(5) 76(9) | 245 | 4:03 | 59.51 |
| 09 | Cincy | Hard | Djo | 61 64 | 111 | 1:32 | 49.73 |
| 09 | Paris | Hard | Djo | 62 63 | 88 | 1:17 | 52.50 |
| 09 | WTF | Hard | Djo | 76(5) 63 | 144 | 1:58 | 49.17 |
| 10 | USO | Hard | Nad | 64 57 64 62 | 255 | 3:43 | 52.47 |
| 10 | WTF | Hard | Nad | 75 62 | 123 | 1:52 | 54.63 |
| 11 | IW | Hard | Djo | 46 63 62 | 158 | 2:26 | 55.44 |
| 11 | Miami | Hard | Djo | 46 63 76(4) | 205 | 3:22 | 59.12 |
| 11 | Madrid | Clay | Djo | 75 64 | 133 | 2:18 | 62.26 |
| 11 | Rome | Clay | Djo | 64 64 | 130 | 2:13 | 61.38 |
| 11 | Wimb | Grass | Djo | 64 61 16 63 | 177 | 2:28 | 50.17 |
| 11 | USO | Hard | Djo | 62 64 67(3) 61 | 268 | 4:10 | 55.97 |
| 12 | AO | Hard | Djo | 57 64 62 67(5) 75 | 369 | 5:53 | 57.40 |
| 12 | MC | Clay | Nad | 63 61 | 86 | 1:19 | 55.12 |
| 12 | Rome | Clay | Nad | 75 63 | 143 | 2:21 | 59.16 |
| 12 | RG | Clay | Nad | 64 63 26 75 | 241 | 3:49 | 57.01 |
| 13 | MC | Clay | Djo | 62 76(1) | 139 | 1:52 | 48.35 |
| Yr | Tourn. | Surface | Win | Final Score | Pts | Time | Time/pt |
| Average | 161 | 2:23 | 53.17 |
pretty cool! interesting to see how it plays over in the future.
ReplyDeletebut it does seem from comments that people appreciated the slightly quicker pace of play.
@pitaodsira
Great! I'm love this kind of stuff. I've always thought Rafa seemed to have one the best hawkeye challenge success rates among the guys. Is there any data on that? I emailed Sharko once but he didn't respond.
ReplyDeletei'm convinced of that as well...i was hoping they'd keep records on that from the beginning but they didn't
Deletemonte carlo 2013 final ended so quick because rafa almost sacrificed the set in quick time with his poor play or strong show by djokovic.second set alone was a set resembled earlier ones with real fight & long rallies. hence, short time at monte carlo is an exception that can be ignored.
ReplyDeleteInteresting to see that in 2011, Djokovic didn't try to make the points shorter but on the contrary outplayed Nadal on his own terms. He played Nadal the Nadal way and he did beat him, which must be quite frustrating for Nadal since this is the way he has always beaten his compatriots.
ReplyDelete